
April 8, 2026
Oil prices marched higher this week as the two sides reportedly continue discussions. In the event of a ceasefire that opens the Strait of Hormuz, we would expect oil prices to come down. But the price floor is likely higher than February levels in the $50s given what we’ve seen from the Iranian regime. Outside of geopolitics, artificial intelligence and tech shares returned to the headlines on fresh chip and computer deals, as well as investor chatter around improved relative valuations. Treasury yields were narrowly mixed again, and the U.S. dollar was little changed.
Topics of the Week:
- Earnings Outlook Remains Strong: Consensus expects double-digit S&P 500 EPS (earnings per share) growth in 2026, and estimates are still rising despite geopolitical tension — especially in technology (2026 sector EPS +6% over the past 30 days) and energy (+18%).
- Valuations Have Improved: Stock prices have declined while earnings estimates have risen, resulting in more reasonable valuations. This improves the medium-term risk-reward backdrop for equities.
What We Are Watching:
- Technical Indicators Are Not Fully Supportive Yet: While the S&P 500 has reclaimed November support, it has not yet cleared the 200-day moving average, leaving the short-term downtrend unresolved.
- Oil Price Volatility Poses Inflation Risk: Elevated oil prices could pressure margins for energy-sensitive industries (e.g., airlines, transportation) and create renewed inflation concerns.
Index Data & Market Performance
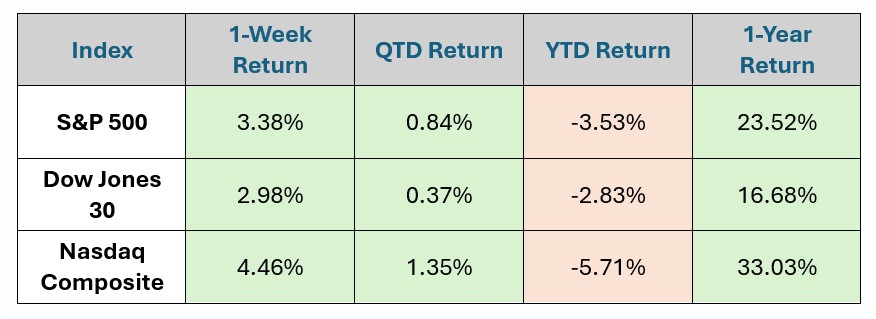
Data as of Market Close 4.6.26
source: gemini.google.com*
In Focus
This week is a critical period for financial markets, headlined by a rare "dual release" of inflation and employment data. Analysts suggest the Fed is in a "wait and see" mode, holding rates steady at 3.50-3.75% while monitoring war-driven price shocks.
Tuesday - Durable Goods Orders
Wednesday – FOMC Minutes (March Meeting)
Thursday – Q4 GDP (Third Estimate), Initial Jobless Claims
Friday – Consumer Price Index (CPI), Consumer Sentiment
What's Trending: Market Resilence
As the Iran conflict enters its second month, geopolitical stress continues to test all investors. Historical stock market performance during geopolitical conflicts helps remind us that stocks are far more resilient than the moment may suggest. As we assess today’s environment and the uncertainties surrounding ongoing military operations in Iran, we focus on two past conflicts we believe are instructive:
1990 Gulf War:
- The U.S. was entering a recession with high inflation and low consumer confidence.
- Equities initially struggled due to flat corporate profits but began recovering before the war ended.
2003 Iraq War:
- The economy had stabilized following the dotcom bust and ’01-’02 accounting scandals.
- Supported by rebounding earnings and favorable monetary policy, the war’s start kicked off a four-year bull market.
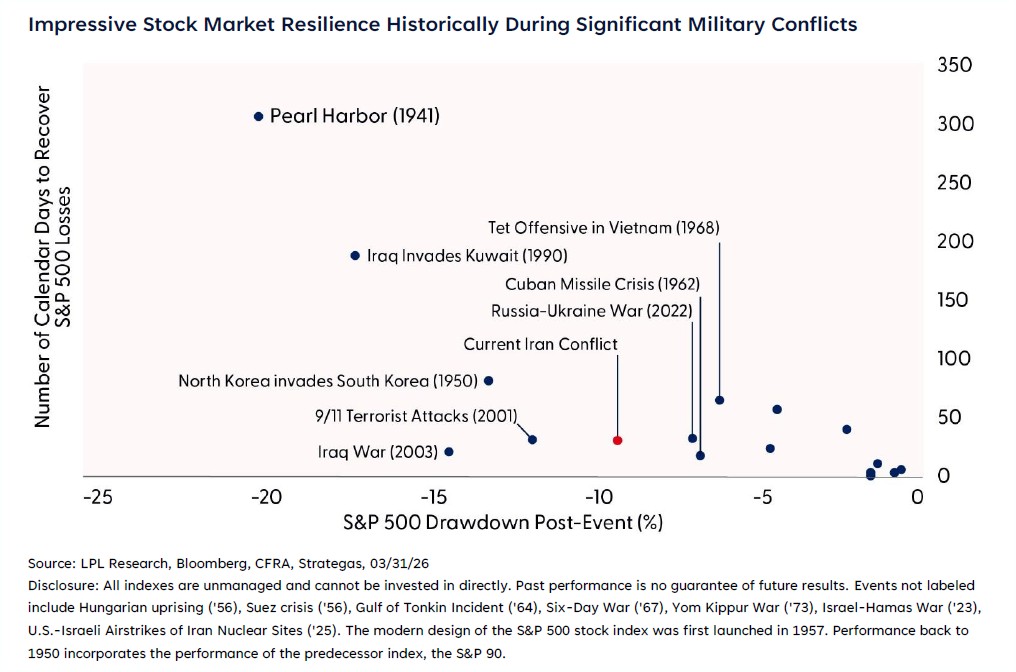
Today, we see elements of both periods — but importantly, we do not see evidence that the long‑term economic or earnings outlook has been meaningfully impaired. From a market perspective, nothing about the current conflict undermines our confidence in the long‑term attractiveness of equities.
Beyond the human element, we can all acknowledge that this environment is uncomfortable. History shows that markets often recover well before geopolitical tensions are fully resolved and frequently with surprising force once clarity begins to emerge.
|
Disclosures
*The data for the total returns of the S&P 500, Dow Jones 30, and NASDAQ Composite are compiled and published by several financial news outlets, index providers, and government/academic sources.
Based on typical financial data providers and the search results, here are the likely sources for this data:
- S&P Dow Jones Indices (S&P Global): This is the official index calculator for the S&P 500 and the Dow Jones Industrial Average (DJIA). They publish index data, including total returns, in daily, weekly, and monthly reports/commentary.
- Nasdaq Global Indexes: They are the official index calculator for the NASDAQ Composite. They also publish fact sheets and performance reports with total return data.
- Financial News Agencies and Publications: News outlets like The Associated Press (AP) and financial publications like Investopedia regularly report on the daily, weekly, and year-to-date (YTD) returns of these major U.S. indexes.
- Federal Reserve Economic Data (FRED) / St. Louis Fed: FRED, maintained by the Federal Reserve Bank of St. Louis, is a public resource that often includes daily closing levels for indices like the S&P 500, which can be used to calculate returns.
- Financial Data Platforms (e.g., Bloomberg, YCharts, MSCI): Professional and commercial financial data providers often republish or calculate returns based on the official index data for their clients.