
October 13, 2026
Stocks touched a new record high this week, then bounced around on mixed headlines. Under the surface, leadership shifted between parts of the market, energy prices stayed in focus, and housing stayed stuck. This week, areas that tend to hold up well when markets get bumpy, such as consumer staples (everyday household products), utilities, and health care, led the way, along with energy. Technology and industrials were roughly flat.
Topics of the week:
- Energy prices are back in the spotlight. Oil ended the week flat but is still up roughly 59% so far this year, and energy stocks are up about 46%, far ahead of any other part of the market. Supply worries are the reason. Shipping through the Strait of Hormuz has been disrupted, and a hurricane this week shut down some oil production in the Gulf of Mexico. Natural gas prices also rose more than 5% for the week.
- Housing is stuck, and families are feeling it. Mortgage rates climbed above 7% in mid-September and, as of October 6, were at their highest level since January 2025. That is still below the October 2023 peak of 8.1%, but it matters for a simple reason: many homeowners hold loans at much lower rates, so they are reluctant to sell and give them up. Fewer homes for sale keeps prices high and keeps buyers on the sidelines.
What we are watching:
- Borrowing costs are becoming more manageable. Competition among lenders is narrowing credit spreads, meaning banks charge businesses a smaller premium above their funding costs.
- Business investment may support growth. Increased borrowing could fund equipment, technology, and infrastructure projects that improve productivity and help sustain economic expansion.
Index Data & Market Performance
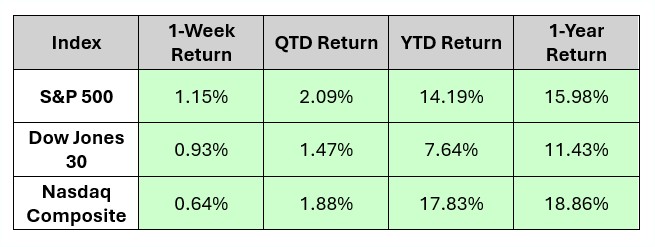
Data as of Market Close 10.12.26
source: gemini.google.com*
In Focus
Financial markets face a week packed with critical economic data releases and the official launch of the Q3 corporate earnings season. Economists project the annual consumer inflation rate to accelerate to 3.6%. A higher-than-expected print could lock in further rate hikes or prompt longer pauses by the Fed.
Key Reports:
- Monday: No major economic reports are scheduled.
- Tuesday: Small business optimism, a survey of how confident owners are about hiring and growth, plus Existing Home Sales
- Wednesday: The big one. The Consumer Price Index, or CPI, is the main inflation report and measures how fast everyday prices are rising. The Fed's Beige Book also arrives, a collection of stories from businesses around the country about how the economy feels on the ground.
- Thursday: Retail Sales
- Friday: Industrial Production, which tracks output at U.S. factories, mines, and utilities, plus import and export prices.
What's Trending: Leadership is rotating under the surface
Leadership is rotating under the surface. The S&P 500 hit a record high early in the week, its first since August, and finished the week higher. But who is leading the market has changed. Over the past month, technology and communication services (home to many of the big AI-linked companies) did the heavy lifting, while financials, real estate, utilities, and materials slipped. This week flipped that script. Companies that sell everyday necessities, utilities, energy, health care, and consumer discretionary all gained roughly 3% to 4%, while technology and industrials were about flat.
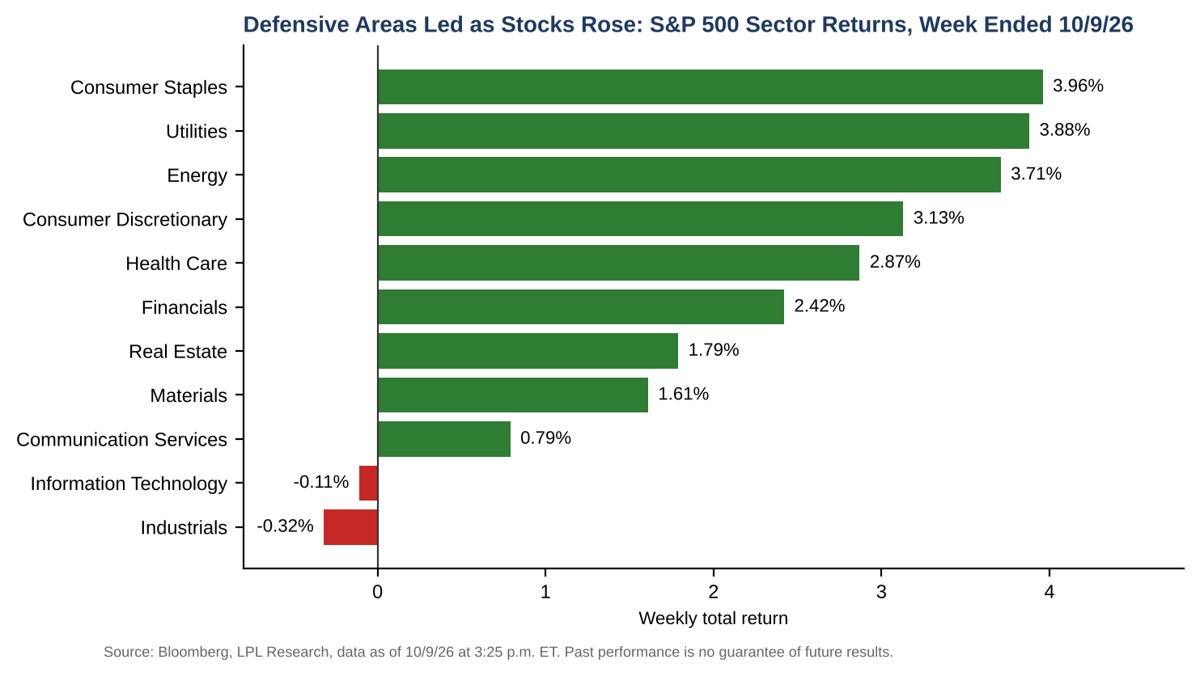
One week does not make a trend, and headlines stayed choppy, with conflicting reports about possible U.S. action in the Middle East and renewed questions about AI spending. Rotations like this are exactly why we keep portfolios diversified rather than leaning on whatever has been winning lately.
|
Disclosures
*The data for the total returns of the S&P 500, Dow Jones 30, and NASDAQ Composite are compiled and published by several financial news outlets, index providers, and government/academic sources.
Based on typical financial data providers and the search results, here are the likely sources for this data:
- S&P Dow Jones Indices (S&P Global): This is the official index calculator for the S&P 500 and the Dow Jones Industrial Average (DJIA). They publish index data, including total returns, in daily, weekly, and monthly reports/commentary.
- Nasdaq Global Indexes: They are the official index calculator for the NASDAQ Composite. They also publish fact sheets and performance reports with total return data.
- Financial News Agencies and Publications: News outlets like The Associated Press (AP) and financial publications like Investopedia regularly report on the daily, weekly, and year-to-date (YTD) returns of these major U.S. indexes.
- Federal Reserve Economic Data (FRED) / St. Louis Fed: FRED, maintained by the Federal Reserve Bank of St. Louis, is a public resource that often includes daily closing levels for indices like the S&P 500, which can be used to calculate returns.
- Financial Data Platforms (e.g., Bloomberg, YCharts, MSCI): Professional and commercial financial data providers often republish or calculate returns based on the official index data for their clients.