
April 15, 2026
On Monday, the S&P 500 opened weakly but closed strong, hitting its highest level since late February and erasing 2026 losses. Financials and technology shares topped the leaderboard this week, with the latter supported by a big bounce in software. Fairly busy news flow gave investors plenty to analyze, with March wholesale inflation ticking higher. Outside of geopolitics, attention turned to the upcoming earnings season, acting as a test for stocks.
Topics of the Week:
- Economic Resilience: Despite multiple shocks, the economy continues to grow, supported by stable employment, solid business investment, and strong corporate profits.
- Technology Investment Supports Growth: Continued investment in AI, software, and digital infrastructure is helping offset weaker areas of the economy and support overall growth.
What we are watching:
- Slower Consumer Spending: Household spending has softened compared to prior quarters, which may limit near‑term economic momentum.
- Tighter Financial Conditions Abroad: While U.S. credit conditions remain relatively calm, funding stress has increased in some international markets, which bears monitoring.
Index Data & Market Performance
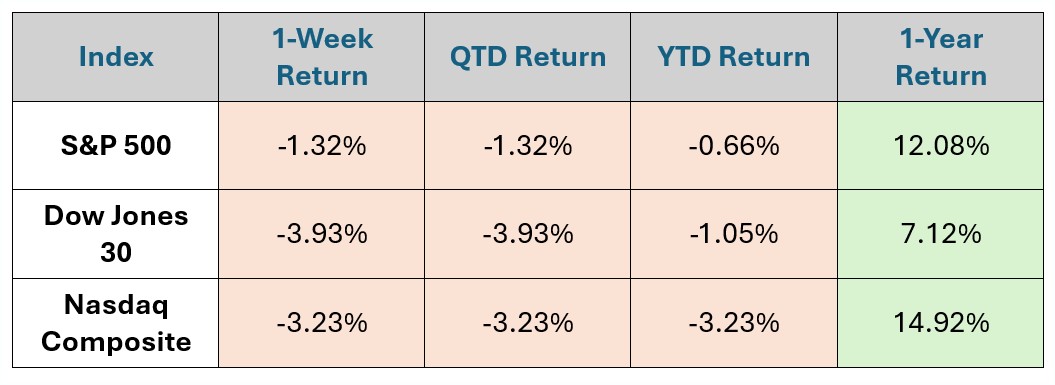
Data as of Market Close 4.13.26
source: gemini.google.com*
In Focus
The key market reports for this week focus on inflation indicators (PPI) and manufacturing health, alongside a heavy schedule of major bank earnings. Inflation remains the dominant market narrative, with a "higher for longer" interest rate environment now expected.
Monday - Existing Home Sales
Tuesday - Producer Price Index (PPI)
Wednesday – Import / Export Prices
Thursday – Jobless Claims
Friday – Housing Starts
What's Trending: Markets Hold Firm
Outside of energy commodities, capital markets posted a downbeat March as cross-asset volatility spiked in response to the outbreak of hostilities in the Mideast, and kicked off April in a similar, choppy fashion before posting a swift bounce following last Wednesday’s two-week ceasefire agreement.
Key data points:
Headline inflation rose 0.9%, with roughly 80% of the increase directly attributable to energy, and an even larger share when the spike in airfares is included.
- Medical care and used vehicle prices both declined in March.
- Initial unemployment claims remain low, suggesting the labor market is holding steady despite slowing growth.
- Corporate profits rose $246.9 billion in Q4, accelerating from a $175.6 billion increase in Q3.
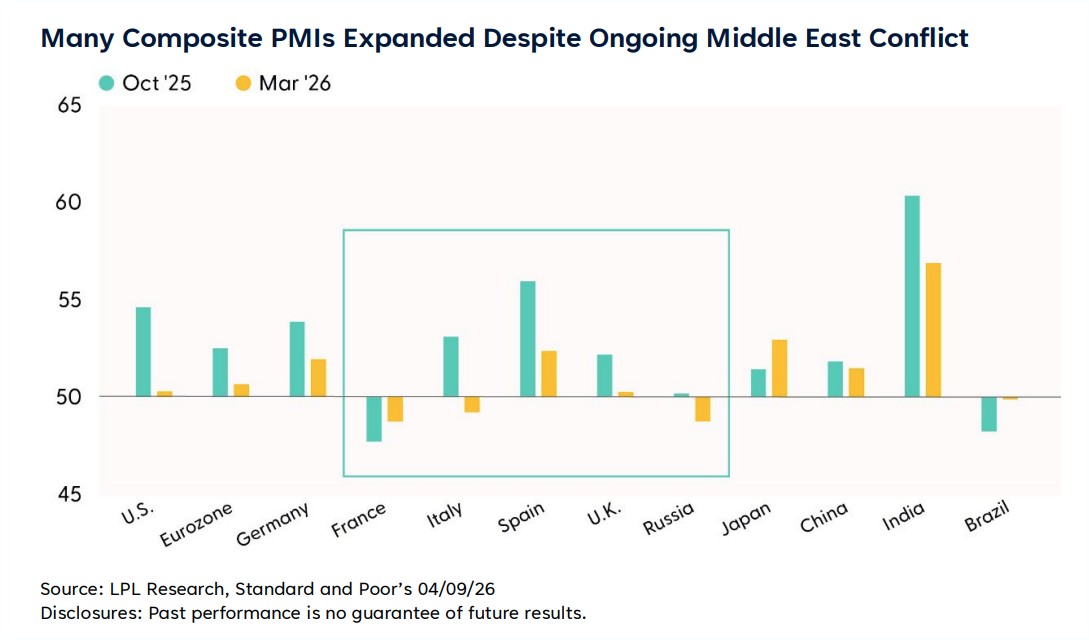
Purchasing Manager Indexes (PMIs) for several important global economies are holding steady in the face of an energy supply crisis. For March, many country PMIs were above 50, implying business expansion. If the Middle East crisis is resolved by the end of April, the global economy will most likely skirt recession.
|
Disclosures
*The data for the total returns of the S&P 500, Dow Jones 30, and NASDAQ Composite are compiled and published by several financial news outlets, index providers, and government/academic sources.
Based on typical financial data providers and the search results, here are the likely sources for this data:
- S&P Dow Jones Indices (S&P Global): This is the official index calculator for the S&P 500 and the Dow Jones Industrial Average (DJIA). They publish index data, including total returns, in daily, weekly, and monthly reports/commentary.
- Nasdaq Global Indexes: They are the official index calculator for the NASDAQ Composite. They also publish fact sheets and performance reports with total return data.
- Financial News Agencies and Publications: News outlets like The Associated Press (AP) and financial publications like Investopedia regularly report on the daily, weekly, and year-to-date (YTD) returns of these major U.S. indexes.
- Federal Reserve Economic Data (FRED) / St. Louis Fed: FRED, maintained by the Federal Reserve Bank of St. Louis, is a public resource that often includes daily closing levels for indices like the S&P 500, which can be used to calculate returns.
- Financial Data Platforms (e.g., Bloomberg, YCharts, MSCI): Professional and commercial financial data providers often republish or calculate returns based on the official index data for their clients.