
July 29, 2026
Wall Street chatter continued to surround ongoing momentum weakness as well as elevated capital expenditures and Chinese competition worries within the artificial intelligence (AI) trade. Lower oil futures also helped alleviate some upward pressure on Treasury yields, both supportive for stocks. On the earnings front, shares of Coca-Cola (KO) rose on a positive outlook, and Boeing shares (BA) edged higher on better-than-expected cash flow and healthy demand. Consumer staples and communication services are leading gains while energy shares are lagging.
Topics of the week:
Strong Cloud and AI Demand: Demand for AI services remains robust, and cloud computing growth appears to be accelerating as businesses continue adopting AI technologies. This has supported investor confidence and helped drive a strong market rebound in the second quarter.
Profitable Businesses: Leading cloud providers already generate substantial profits, giving them resources to invest in future growth.
What we are watching:
Enormous Capital Spending: AI infrastructure requires significant spending on data centers, computer chips, and related equipment. These investment levels increasingly resemble traditional infrastructure projects rather than software businesses.
Higher Burden of Proof: Investors are no longer focused solely on growth. Companies must demonstrate that AI investments can generate sufficient profits and returns, not just revenue growth.
Index Data & Market Performance
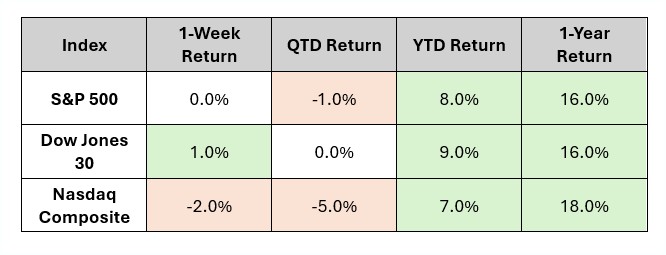
Data as of Market Close 7.27.26
source: gemini.google.com*
In Focus
Fed Week: To Hike or Not to Hike, That is the Question
This is a crucial meeting for the Warsh-led Federal Reserve. Rate decision probabilities have fluctuated due to resurgent oil prices pushing above $100 a barrel and lingering inflation anxieties. Markets are hyper-focused on whether the policy statement leans toward a "higher-for-longer" stance.
Key Reports:
Tuesday – S&P/CoreLogic Case-Shiller Home Price Index, Consumer Confidence
Wednesday – FOMC Interest Rate Decision & Policy Statement
Thursday – Initial Jobless Claims
Friday – U.S. Consumer Sentiment Survey
What's Trending: Midterm Market Cycle
The Historical Setup Improves After Midterms
With midterm elections fast approaching, history suggests investors may be better served focusing on market behavior rather than political predictions. Investors should expect fewer large legislative changes and more volatility around key issues like government funding and the debt ceiling.
What you need to know:
- A divided Congress typically reduces the likelihood of sweeping legislative changes, but it can also increase uncertainty around government funding, fiscal policy, and regulatory initiatives.
- That uncertainty often translates into market volatility, particularly during the months leading up to the midterm elections.
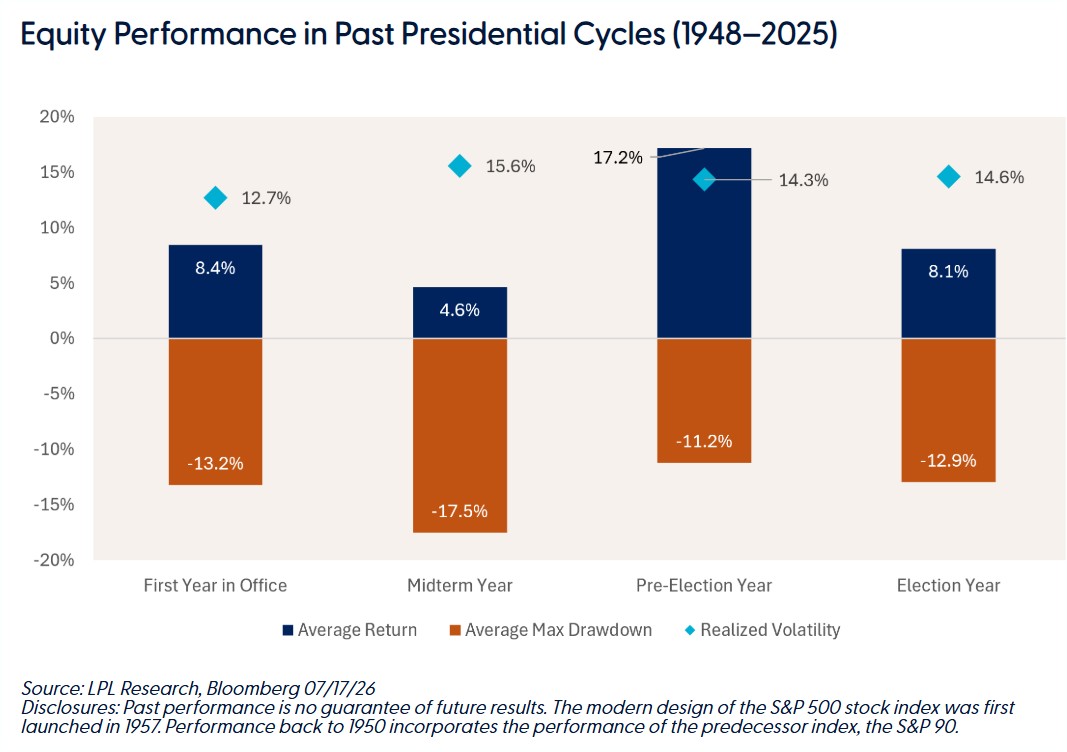
- The year following midterm elections, the pre-election year, has generated the strongest average annual S&P 500 return at 17.2%, significantly above returns during first-year, election-year, and midterm-year periods.
- Looking at the chart below, midterm years have produced the weakest average annual return of the four-year presidential cycle at just 4.6%.
- For investors, the key takeaway may be simple: political outcomes matter, but market behavior around those outcomes matters more.
|
Disclosures
*The data for the total returns of the S&P 500, Dow Jones 30, and NASDAQ Composite are compiled and published by several financial news outlets, index providers, and government/academic sources.
Based on typical financial data providers and the search results, here are the likely sources for this data:
- S&P Dow Jones Indices (S&P Global): This is the official index calculator for the S&P 500 and the Dow Jones Industrial Average (DJIA). They publish index data, including total returns, in daily, weekly, and monthly reports/commentary.
- Nasdaq Global Indexes: They are the official index calculator for the NASDAQ Composite. They also publish fact sheets and performance reports with total return data.
- Financial News Agencies and Publications: News outlets like The Associated Press (AP) and financial publications like Investopedia regularly report on the daily, weekly, and year-to-date (YTD) returns of these major U.S. indexes.
- Federal Reserve Economic Data (FRED) / St. Louis Fed: FRED, maintained by the Federal Reserve Bank of St. Louis, is a public resource that often includes daily closing levels for indices like the S&P 500, which can be used to calculate returns.
- Financial Data Platforms (e.g., Bloomberg, YCharts, MSCI): Professional and commercial financial data providers often republish or calculate returns based on the official index data for their clients.